
The contours of our systemic crisis
February 26, 2025

As the first Next System Speaker of 2025, TDC President Joe Guinan spoke to George Mason University’s Next System Studies Class about what TDC’s 2024 Index of Systemic Trends says about the present crisis facing America.
The following is the text of his remarks.
*
Good afternoon. My name is Joe Guinan, I am the President of The Democracy Collaborative.
We’re an action-oriented think-do tank based in Washington, DC, and Cleveland, Ohio seeking to build a democratic economy through political-economic system change from the ground up.
We do this in two ways: through our on-the-ground practice — what we call Community Wealth Building —and through interventions in the ideas system and at the level of policy and politics — to promote and advance a democratic economy as the next system of political economy.
A big thanks to Ben Manski for inviting me back here, it’s a real pleasure to be part of your class today.
*
The conversations you are having through Next System Studies are some of the most important conversations you could be having, given the dangerous state of the world today.
Because truly we are staring into an abyss.
We need to get to grips with the multi-faceted crisis we are facing, which is not just a political or economic or ecological crisis (although it is increasingly all those things) but a crisis of our system of political economy.
“We need to get to grips with the multi-faceted crisis we are facing, which is not just a political or economic or ecological crisis (although it is increasingly all those things) but a crisis of our system of political economy.”
And today I’ll explain what I mean by that.
Understanding and figuring out how people can traverse this systemic crisis is a necessary precondition for everything that follows.
Because today we are on the brink of worldwide crisis — and the stakes of the next few years could hardly be higher. The word fascism is now being readily used, advisedly so.
But at bottom the important thing is that we should not mistake symptoms for causes.
Reemerging fascism is a symptom of a system in crisis and decay.
That crisis extends way beyond Donald Trump — even as we must pay very careful attention to how he, and those forces arrayed around him, seek to use it to their advantage.
So, let’s zoom out from symptoms to causes, to the contours of the present crisis.
Today’s systemic crisis
Today a deep and abiding sense of economic disempowerment has taken hold across many advanced industrial societies, producing boiling anger amongst voters at a system they see as stacked against them.
They are not wrong.
For decades – under Clinton and Obama and Biden no less than Reagan and the Bushes – virtually all the gains to the economy have been captured by the very rich, while the vast majority received a declining share of increasing productivity.
“For decades – under Clinton and Obama and Biden no less than Reagan and the Bushes – virtually all the gains to the economy have been captured by the very rich, while the vast majority received a declining share of increasing productivity.”
For this I’m going to use a couple of slides.
Index of Systemic Trends
So let’s talk briefly about what’s happening in America’s political-economic system through the lens of the 2024 edition of The Democracy Collaborative’s Index of Systemic Trends – which is a data bank of economic, social, environmental and political indicators of the health of the United States.
I’ll get to the heart of what we at TDC see as the essence of what’s going wrong with our economy.
You can find the Index of Systemic Trends online at index.democracycollaborative.org.
It is a compilation of publicly available data from government (for the most part) and nonprofits that we bring together as a kind of dashboard for the overall health and direction of the system over time.
I want to thank my friend the economist Howard Reed of Landman Economics for his work with us on compiling all this data.
The trends considered in the Index include poverty, wealth inequality, racial wealth inequality, income inequality, wage stagnation, the cost of higher education, homeownership, corporate taxation, taxation of the rich, labor union density, incarceration rates, healthcare costs, climate change, and life expectancy, among others.
*
We first brought out the Index in 2019, and so this second edition comes five years later, a suitable amount of time after which to check back in for substantial changes in direction. And of course it has been a very eventful five years, to say the least.
A great deal has happened in the intervening five years since we first published the Index in 2019, be it the closing act of the first Trump presidency, COVID-19, the onset of the new inflation, the enactment of large-scale new federal programs as part of the “Bidenomics” agenda, or other external shocks such as wars, trade and supply chain disruptions, and food and energy price spikes – not to mention increasing weather effects from the growing catastrophe of global climate change.
But while a lot has happened and there have been significant efforts to change course, what our Index shows is that the scale and pace of these changes has not been enough to bend the curve on many long-running trends in the U.S. political economy, whether economic inequality or poverty or health outcomes or labor union density or the racial wealth gap.
We continue to store up great difficulties for the future – and increasingly these chickens are now coming home to roost in the present.
The dashboard warning lights are blinking urgently.
And nothing on the table from our current politics has anywhere near the capacity to make serious improvements – although there remains a lot of scope for further deterioration and things getting much worse.
“One of the ways you can tell that a crisis is systemic, rather than purely political or economic, is that key indicators decline or stay the same regardless of changes in political power or business cycles.”
*
One of the reasons we put together this Index is to take the long view.
When we talk about a systemic crisis, we are not being rhetorical but are responding to the clear story told by the data.
One of the ways you can tell that a crisis is systemic, rather than purely political or economic, is that key indicators decline or stay the same regardless of changes in political power or business cycles.
Since 1970, the United States has experienced eight party changes in the White House, seven party changes in control of the Senate, and four in the House of Representatives.
It has also experienced eight recessions (and recoveries).
Any yet, for all the ups and downs of the political cycle, for most Americans on many very important indicators of economic, social, and democratic health there has been little improvement and, in many cases, substantial ongoing deterioration over this period.
There is a great deal of data in the Index, which you are welcome to peruse at leisure. But let me cut to the chase of this story, with a few of what I think are the key charts.
They explain the growing gulf between headline economic numbers and the way in which most Americans are experiencing the vast wealth of the system – one of the richest political economies in the history of the world but one that, for the majority, feels like anything but.
*
Let’s start with a famous chart, wages and productivity:
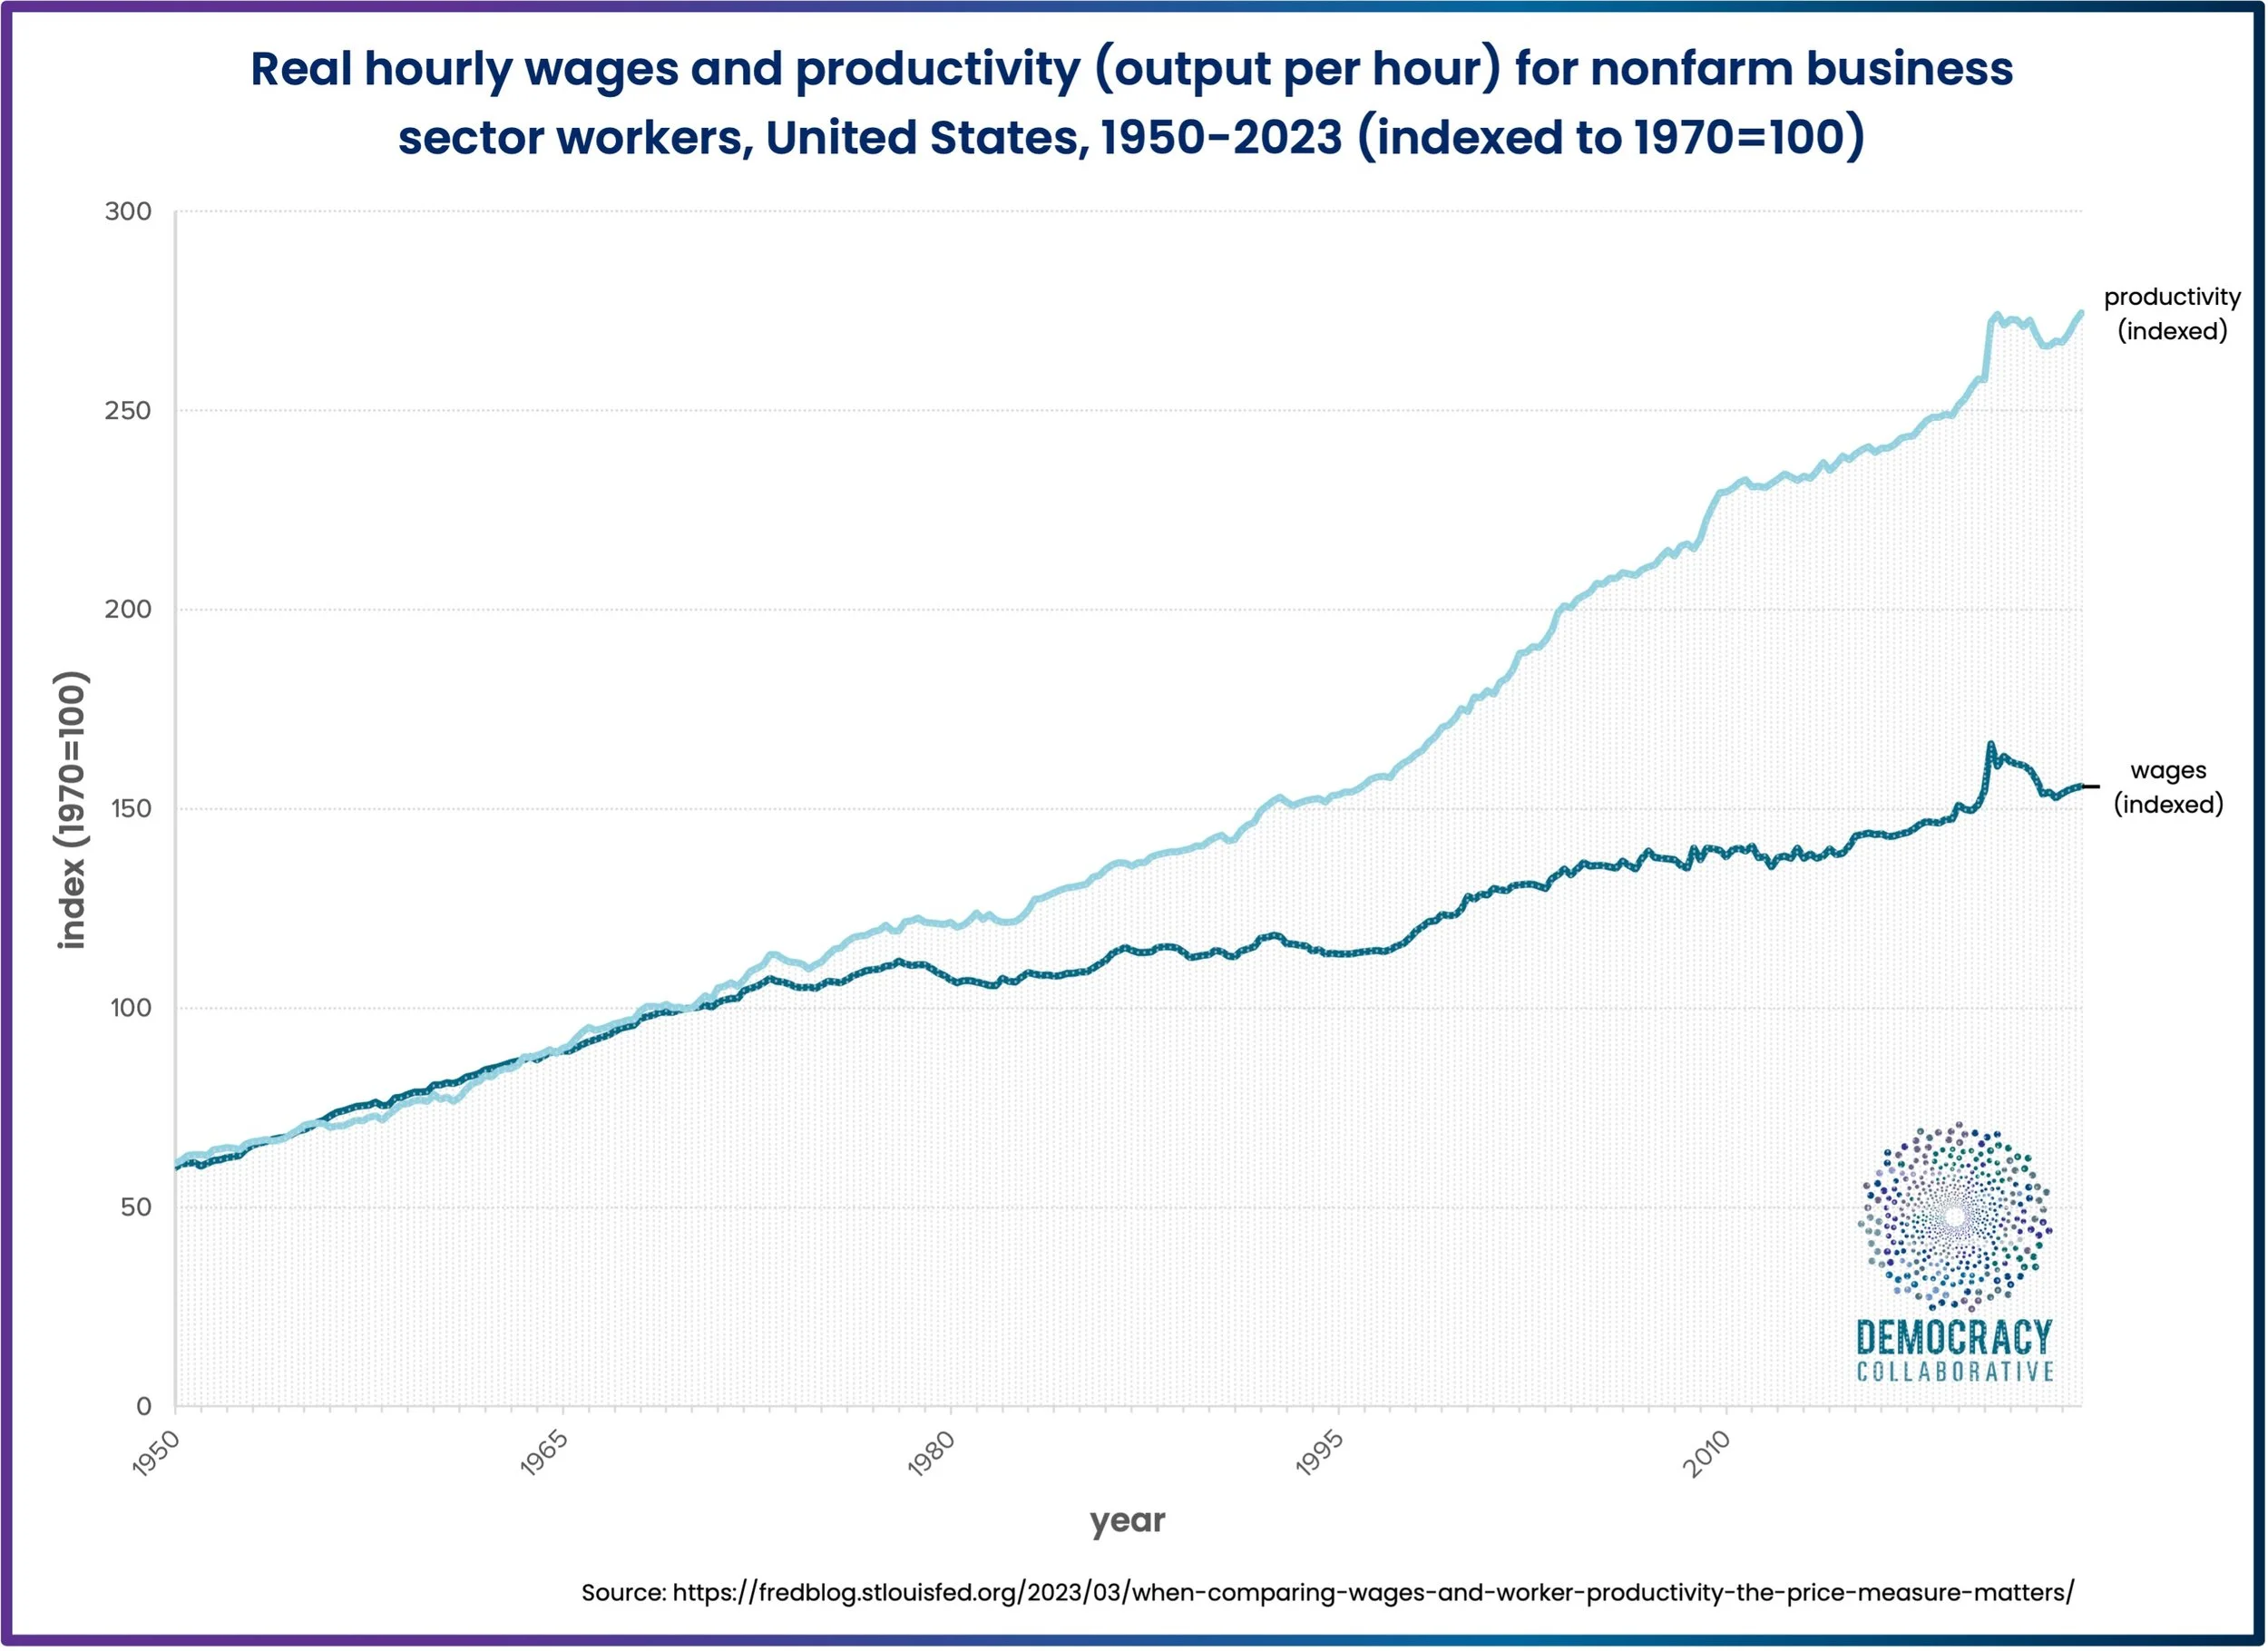
What this chart shows is that at a critical point in the 1970s there was a ‘decoupling’ of wage growth from the overall productivity of the U.S. economy.
“At a critical point in the 1970s there was a ‘decoupling’ of wage growth from the overall productivity of the U.S. economy.”
The system continued to increase in its productive power, but these gains were not translated into wage gains at the same rate.
We see wages increasing by around 60 percent in real terms over the period since, but productivity increasing at a much faster rate.
You can view this as in many ways the end of the social contract that implicitly governed American capitalism during the so-called “golden years” of the postwar period.
But it gets worse.
For this decoupling has also been accompanied by growing income and wealth inequality within the wage share of national product:

Starting with income, you see here the shares of the bottom 50% versus the top 10% and 1% of the income distribution.
The share of income held by the top 1 percent fell from around 17% in 1950 to around 10% by the mid-1970s before rising in the 1980s, 1990s, 2000s and 2010s – to 21%, more than double its 1970s level – in 2022.
The share of income of the top 10 percent rose from 33% in the mid-1970s to 48% by 2022, while the share of the bottom 50 percent fell from just over 20% to less than 10% over the same period.
What layering on income inequality gives us is a worsening of the position in the first chart.
The vast majority of the growth in incomes since the 1970s has gone to the very top of the income distribution.

If you look at the vast majority of workers, using the Bureau of Labor Statistics category of “production and nonsupervisory workers” — that’s 7 out of 10 workers, 110.4 million of a total workforce of 159.4 million — then the average U.S. worker hasn’t had a real terms pay increase since the 1970s, when Richard Nixon was in the White House!
All the gains to the system over a period of half a century have gone to the top!
That is an astounding fact and an incredible period of wage stagnation.
*

It gets still worse. As you probably know, wealth inequality is even worse than income inequality.
Since 1970, the wealth share of the top 1 percent has substantially increased, while that of the middle 40 percent has fallen.
The bottom 50 percent has seen virtually no improvement, with any gains wiped out during the 2008 financial crisis.
Once again, the vast wealth of the United States’ economy is not experienced as such by most Americans.
GDP may increase, the stock market may rise, but for many there is a growing squeeze on incomes and an accumulating consumer debt burden.
We see this in the financial fragility of so many American households:
In the Federal Reserve’s Economic Well-Being of U.S. Households in 2023 report, 37% of all adults, faced with a hypothetical unanticipated expense of $400 (such as a car repair or a modest medical bill), said they would have paid by borrowing or selling something or said they would not have been able to cover the expense at all.
“The vast wealth of the United States’ economy is not experienced as such by most Americans. GDP may increase, the stock market may rise, but for many there is a growing squeeze on incomes and an accumulating consumer debt burden.”
In her recent book, Wealth Supremacy, my colleague Marjorie Kelly points to the condition of asset poverty of the two in three Americans who have next-to-nothing to fall back on in case of an emergency.
There is also data in the Index on wealth by race showing the extent of the racial wealth gap, as well as the way the financialization of the economy is widening racial wealth inequality.
*
I don’t want to leave you with an impression that nothing can be done, that we are simply at the mercy of large structural economic forces.
On the contrary, it is possible to bend the curve on some of these trends – it’s just that our political system won’t allow it.
One of the most shocking stories emerging out of the last five years, for me at least, is the story of child poverty in America:

This chart shows the child poverty rate in the United States since 2009 using the Supplemental Poverty Measure, a more comprehensive definition.
Child poverty on this definition fell gradually between 2014 and 2019, from around 18% to around 12.5%.
There was then a very substantial fall in poverty in 2020 and 2021 – to just over 5% in 2021 – as a direct result of the measures in the Coronavirus Aid, Relief and Economic Security (CARES) Act and temporary expansions of the SNAP program in 2020, and the extensions to the Child Tax Credit in the American Rescue Plan (ARP) in 2021.
Analysis by the Center for Budget and Policy Priorities shows that without the expansion of the Child Tax Credit in 2021, child poverty on the SPM measure would have been 8.1% instead of the actual figure of 5.2%.
When the Child Tax Credit expansions were withdrawn in 2022, poverty increased again, to 12.4%.
These striking statistics show that the U.S. government has the ability to substantially reduce child poverty via transfer payment programs.
“America almost abolished, but then brought back, child poverty during the COVID-19 pandemic.”
The response to COVID-19 temporarily reduced child poverty massively, but when these measures lapsed, child poverty returned to its former level.
America almost abolished, but then brought back, child poverty during the COVID-19 pandemic.
*
Lastly, there are the political consequences of running a system in which all the gains go to the very top for an extended period of time.
It’s not politically sustainable, there is inevitably a backlash.
This is a significant aspect of the current political crisis in America.

This chart shows results for the proportion of respondents expressing “very little” or “no” confidence in the three most important government institutions in the United States – the presidency, Congress, and the Supreme Court – since 1973.
The results show an upward trend in lack of confidence – to the point where we are experiencing a legitimation crisis in our democratic institutions.
There are good reasons to question whether a democratic polity and an increasingly plutocratic economy are compatible over the long run.
“The results show an upward trend in lack of confidence – to the point where we are experiencing a legitimation crisis in our democratic institutions. There are good reasons to question whether a democratic polity and an increasingly plutocratic economy are compatible over the long run.”
In words often attributed to U.S. Supreme Court Justice Louis Brandeis, “We can have a democratic society or we can have the concentration of great wealth in the hands of a few. We cannot have both.”
*
This data in the Index of Systemic Trends demonstrates the real basis of the systemic crisis in America.
There is also the daunting data on the growing existential threat of climate change, which is already here and was recently experienced in North Carolina and Florida and California in the Los Angeles fires.
If we aren’t careful all this can be disempowering, and lead to hopelessness and despair.
Personally, I don’t think that is the takeaway message.
For me, the crisis as demonstrated in the data demands a response that is on the scale of and capable of bending the trajectory of the difficulties that we’ve been piling up for decades now.
It means we need structural and transformative interventions in the economy that change the ways it works – and whom it works for.
It poses a stark choice: continue to live within the parameters of the existing system and experience the inevitable ongoing downward trajectory – or take action and make interventions that are capable of putting us on a different course.
An Economy for the Future
To rise to this challenge and develop an economy for the future will likely require a shift in the ownership and control of capital that dwarfs even such radical previous episodes in history as the industrial revolution or the upheavals of the twentieth-century, whilst seeking to do so peaceably and on the basis of a rebuilding and reconstruction of community in democratic public life.
Developing the politics and strategy that can pull this off is the fundamental epochal challenge of our age—and must become the central mission of transformative political action in the years ahead.
We can no longer work on the basis of what might be called social democratic or liberal redistributive strategies that seek to allow capitalism to produce growth and then clean up around the edges with regulation and redistributive social spending “after the fact.”
We are up against an economy whose natural workings increasingly make that impossible.
The institutional arrangements at the heart of today’s capitalism — private ownership, credit creation by banks, global capital markets, giant publicly traded corporations — together form the most powerful engine for the extraction of value the world has ever seen.
“The institutional arrangements at the heart of today’s capitalism — private ownership, credit creation by banks, global capital markets, giant publicly traded corporations — together form the most powerful engine for the extraction of value the world has ever seen.”
It is this set of relationships, this basic institutional design, that drives the outcomes we are seeing in terms of crumbling public infrastructure, social atomization, uneven development, environmental destruction and a widespread sense of popular disempowerment.
If we are serious about addressing real economic challenges then we need a different set of institutions and core economic arrangements capable of producing sustainable, lasting and more democratic outcomes — a new paradigm, a democratic economy in support of a democratic polity, a next system.
*
And that is where you come in, with Next System Studies.
Crises of climate, of inequality, of racial injustice are already upon us, demanding clear and credible answers.
Collectively, we must craft a powerful strategic response to the rapidly changing political environment.
I believe we have the models and tools and knowledge to do it, and the challenge is one of politics and power — and therefore of democracy.
Which means it is up to all of us.
*
I’ll stop there and we can have a discussion.
Thank you.